Trading The Cup And Handle Pattern
Spotting, Entering, and Setting Profit Targets on a Cup and Handle Pattern
Chart patterns occur when the price of an asset moves in a way that resembles a common shape. Such patterns look like a triangle, rectangle, head and shoulders, or in this case – a cup and handle. These patterns are a visual way to trade. They provide a logical entry point, a stop-loss location for managing risk, and a price target for exiting a profitable trade.
Learn about the cup and handle. How to trade it, and what to watch for to improve the odds of a profitable trade.
Key Takeaways
- The cup and handle pattern resembles a U shape with a horizontal line, generally drifting downward.
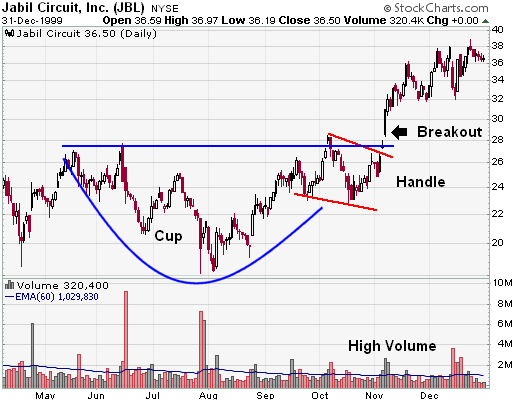
- The cup and handle pattern is a bullish pattern followed by a breakout.
- The cup and handle can take weeks or months to form.
- Traders use this indicator to find opportunities to go long.
The Cup and Handle
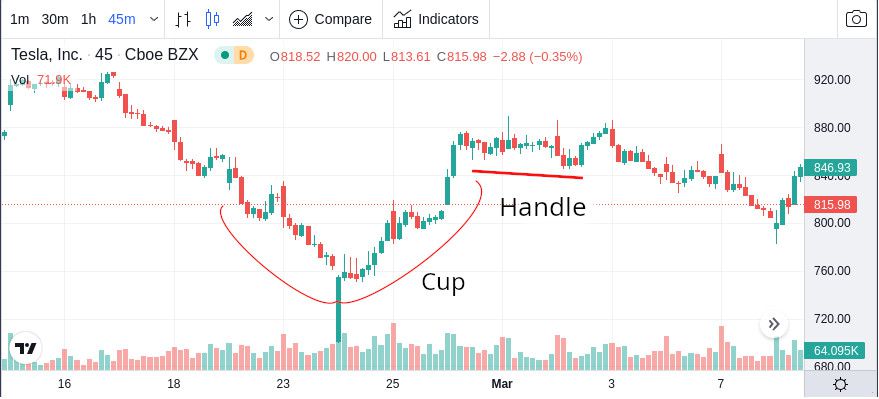
The cup and handle pattern occurs in small time frames, like a one-minute chart. Also in large time frames, like daily, weekly, and monthly charts. It occurs when a price wave is downward, followed by a stabilizing period. Prices then rally to an approximately equal size to the prior decline. It creates a U-shape or the “cup” in the “cup and handle”. The price then moves sideways or drifts downward within a channel, forming the handle. The handle may also take the form of a triangle.
The handle needs to be smaller than the cup. It should not drop into the lower half of the cup, and ideally, it should stay in the upper third. For example: if a cup forms between $99 and $100, the handle should form between $100 and $99.50, ideally between $100 and $99.65. If the handle dives too deep and erases most of the gains of the cup, you should avoid trading the pattern.
Cup and handle patterns that form at the end of a trend should be avoided because the trend is likely to continue.
A cup and handle chart may signal either a reversal or continuation pattern. A reversal pattern occurs when the price is in a long-term downtrend. It then forms a cup and handle that reverses the trend, and the price starts rising. A continuation pattern occurs during an uptrend; the price rises, forms a cup and handle, and then continues
Entering a Cup and Handle Trade
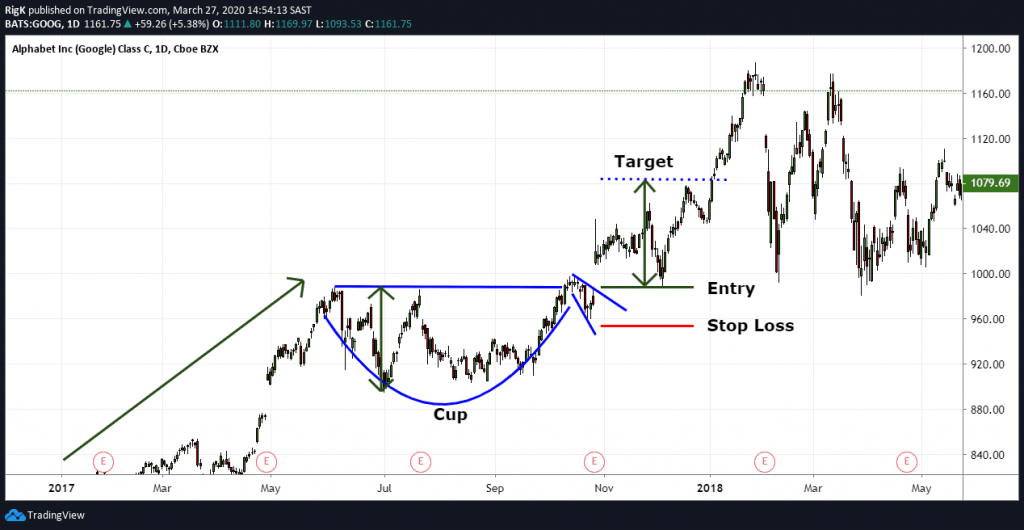
Wait for a handle to form. The handle often takes the form of a sideways or descending channel or a triangle. You should buy when the price breaks above the channel’s top or triangle. When the price moves out of the handle, the pattern is considered complete, and the price is expected to rise.
While the price is expected to rise, that doesn’t mean it will. The price could increase slightly and then fall; it could move sideways or fall right after entry. For this reason, a stop-loss is needed.
Setting a Stop-Loss
A stop-loss order gets a trader out of a trade if the price drops, instead of rallying, after buying a breakout from the cup and handle formation. The stop-loss controls risk on the trade by selling the position if the price declines enough to invalidate the pattern.
Place a stop-loss below the lowest point of the handle. If the price oscillated up and down several times within the handle, a stop-loss might also be placed below the most recent swing low.
Since the handle must occur within the upper half of the cup, a properly placed stop-loss should not end up in the lower half of the cup formation. For example, suppose a cup forms between $50 and $49.50. The stop-loss should be above $49.75 because that is the halfway point of the cup.
If the stop-loss is below the halfway point of the cup, avoid the trade. Ideally, it should be in the upper third of the cup pattern.
By having the handle and stop-loss in the upper half of the cup, the stop-loss stays closer to the entry point. This helps improve the risk-reward ratio of the trade. The stop-loss represents the risk portion of the trade, while the target represents the reward portion.
Picking a Target or Profitable Exit
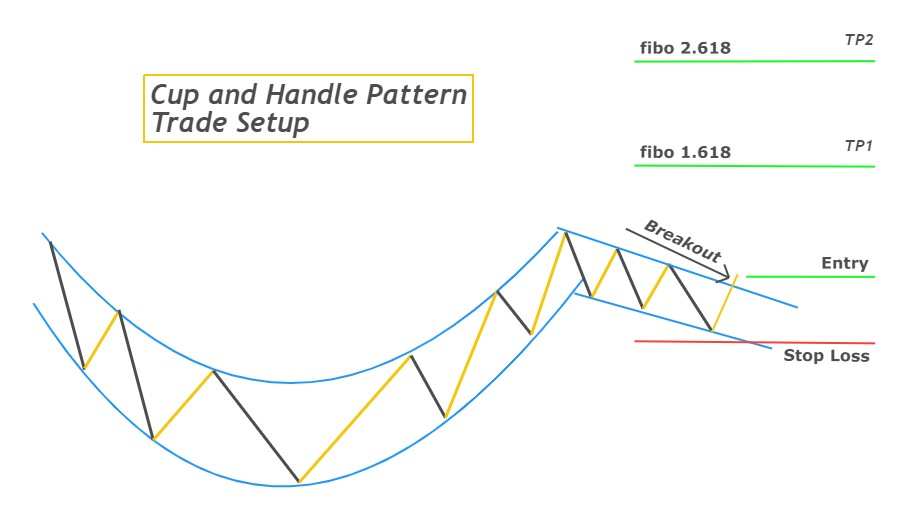
Whatever the height of the cup is, add it to the breakout point of the handle. That figure is the target. For example, if the cup forms between $100 and $99 and the breakout point is $100, the target is $101.
Sometimes, the left side of the cup is a different height than the right. Use the smaller height and add it to the breakout point for a conservative target. You could also use the larger height for an aggressive target.
A Fibonacci extension indicator may also be used. Draw the extension tool from the cup low to the high on the cup’s right. Then connect it down to the handle low.
A trailing stop-loss may also be used to get out of a position that moves close to the target but then starts to drop again.
If you’re day trading, and the target is not reached by the end of the day, close the position before the market closes for the day.
Considerations
Traditionally, the cup has a pause, or stabilizing period, at the bottom of the cup, where the price moves sideways or forms a rounded bottom. It shows the price found a support level and couldn’t drop below it. It helps improve the odds of the price moving higher after the breakout.
A V-bottom, where the price drops and then sharply rallies, may also form a cup. Some traders like these types of cups, while others avoid them. Those that like them see the V-bottom as a sharp reversal of the downtrend. This shows buyers stepped in aggressively on the right side of the pattern.
Opponents of the V-bottom argue that prices don’t stabilize before bottoming. They believe the price may drop back to test that level. But, ultimately, if the price breaks above the handle, it signals an upside move.
If the trend is up and the cup and handle form in the middle of that trend, the buy signal has the added benefit of the overall trend. In this case, look for a strong trend heading into the cup and handle. For additional confirmation, look for the bottom of the cup to align with a longer-term support level, such as a rising trendline or moving average.
If the cup and handle form after a downtrend, it could signal a reversal of the trend. To improve the odds of the pattern resulting in an actual reversal, look for the downside price waves to get smaller heading into the cup and handle. The smaller down waves heading into the cup and handle provide evidence that selling is tapering off, which improves the odds of an upside move if the price breaks above the handle.
Frequently Asked Questions (FAQs)
What Happens After a Cup and Handle Pattern??
If a cup and handle pattern is confirmed, it will be followed by a bullish price move upward. You can pick a price target based on the size of the cup, but it becomes much less clear what will happen after the initial breakout from the cup and handle pattern. For a better idea of what will happen after the cup and handle, zoom out and take a look at a larger time frame. Is there a longer-term uptrend or downtrend? Has the volatility been increasing or decreasing? These sorts of larger contextual clues can help if you plan on holding positions beyond the initial breakout.
How Do You Scan for a Cup and Handle Pattern?
There isn’t a stock scanner setting you can use to find a cup and handle pattern, but the pattern is easy to recognize visually. If you set your stock scanner to meet your other trading needs, then you can flip through the results until you find a chart that looks like a cup and handle. For example, a day trader may scan for stocks with a high average true range (ATR), and a swing trader might search for stocks that have performed well in recent weeks.

If Day Trading is something you would like to try, please practice in a simulator before putting real money on the line. Please learn a trusted profitable strategy. You can learn how to trade here: