Trading Broadening Tops and Bottoms (The Megaphone Pattern)
What Is a Megaphone Pattern & How to Identify These Patterns?
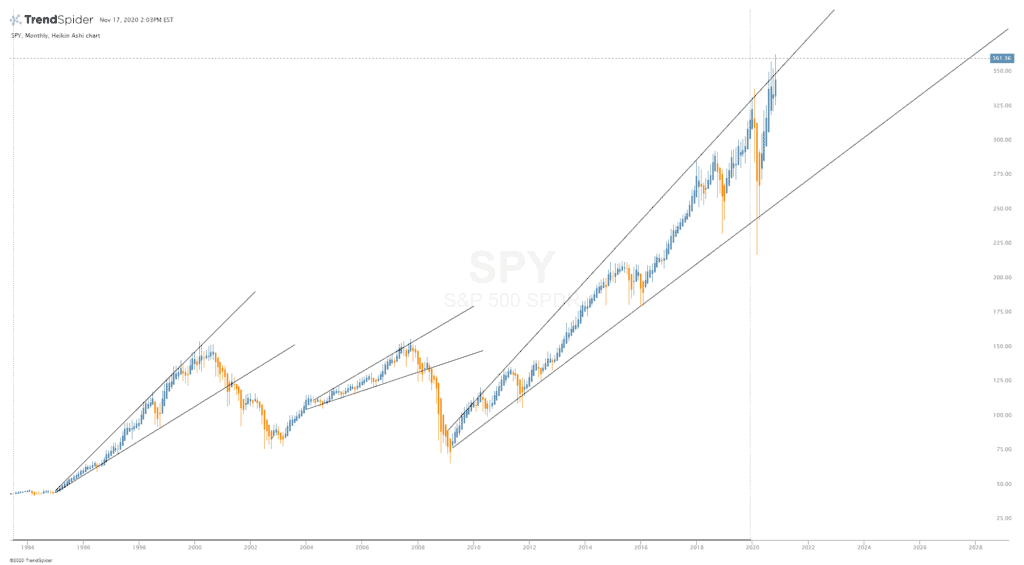
A megaphone pattern consists of a bunch of candlesticks that form a big sloping megaphone shaped pattern. This can be both a bullish or bearish pattern depending on whether it’s sloping upwards or downwards. One this is for sure, the megaphone pattern doesn’t last forever, and can explode upwards or downwards out of the structure at any point in time, but typically after the bottom or top trend lines have been tested 5-8 times.
As the old saying goes, the stock market is a battle of buyer and sellers. The tug of war between the bulls and bears forms patterns like the megaphone chart pattern. This is the bread and butter for traders. No volatility or no identified pattern = no trade! (that’s a rule for me)
That being said, there is great importance of being able to identify patterns and know what they mean. Would you jump in a plane and start flying without knowing what button does what, and without knowing where you are going? I sure hope not!
Basics of Megaphone Patterns
Megaphone patterns are also known as the broadening formation because of the way it forms. During periods of high volatility, stocks can show great movement without seeming to show clear direction.
Hence the formation of a megaphone. It makes higher highs and lower lows at the same time. Typically a stock will only make one or the other because it’s choosing a direction. Everyone is used to talking about higher highs and higher lows when discussing a bullish trend.
Or lower lows and lower highs when discussing a bearish trend…
However, with a megaphone pattern you get both the higher highs and lower lows! There is a lack of a clear trend as a result (except within the megaphone). Trend lines are important part of this pattern, and you must take care with drawing them. Carefully connect your peaks and valleys on both sides to find the price action.
Pivot Levels of Megaphone Chart Patterns
Keep in mind the key pivot levels the stock has produced on the chart and make sure you’re good at connecting the dots. If not it could end up looking more like a triangle pattern. That could potentially change the way you trade. Remember megaphones can form on any time frame, and sometimes there is another pattern within a pattern. (check the daily, weekly, hourly charts first before you make an intraday chart on a 5 minute chart for example.
A broadening formation forms when you use the trend lines to connect the higher highs and lower lows. The resulting picture shows widening pattern. In essence, megaphone patterns look like a reverse symmetrical triangle.
Is Megaphone Pattern Bullish or Bearish?
A megaphone pattern can be bullish or bearish. It’s bullish as it’s rising in an up channel and bearish when it is in a down channel. Watch for price action as it hits the upper and lower channels. The big thing to look out for is what is the trend outside of the megaphone??
In bull markets (weekly and monthly bullish trends) downward megaphones on 60 minute and 4HR time frames can lead to epic bullish reversals. Take the chart of $SPX here as an example. You can see on this 60 minute chart how well the downward megaphone structure has emerged. Price keeps continuing to test the top of the megaphone, more often than the lower side. Why? Bears are losing strength! Why? Well, there are many reasons for that, but the biggest one is the trend. Bears know how STRONG that 50 day moving average is. As price tests it (purple line) bears look to close their short. Bulls look to buy the dip!

What Is a Broadening Formation?
A broadening formation is also knows as a megaphone pattern. Megaphone patterns begin to form when the market begins to have a higher risk over a longer period of time. In fact, elections happen to be a big factor in the formation of a megaphone stock pattern. Uncertainty in general can have a huge impact in developing this pattern.
Why you may ask? The election of a specific person can change the course of a nation. That tends to have an affect on the market. So while the market is unsure of where the political climate may go, it’s fluctuating between being bullish as well as bearish.
Earnings season is another large factor in the forming of a megaphone pattern. Companies reporting their earnings can and will have an affect on a stock.
Good earnings as well as bad earnings cause different reactions. Traders are well aware of how optimism and pessimism affects the stock market. Those reactions form patterns like a broadening formation.
How to Trade Megaphone Patterns
- How to trade megaphone patterns:
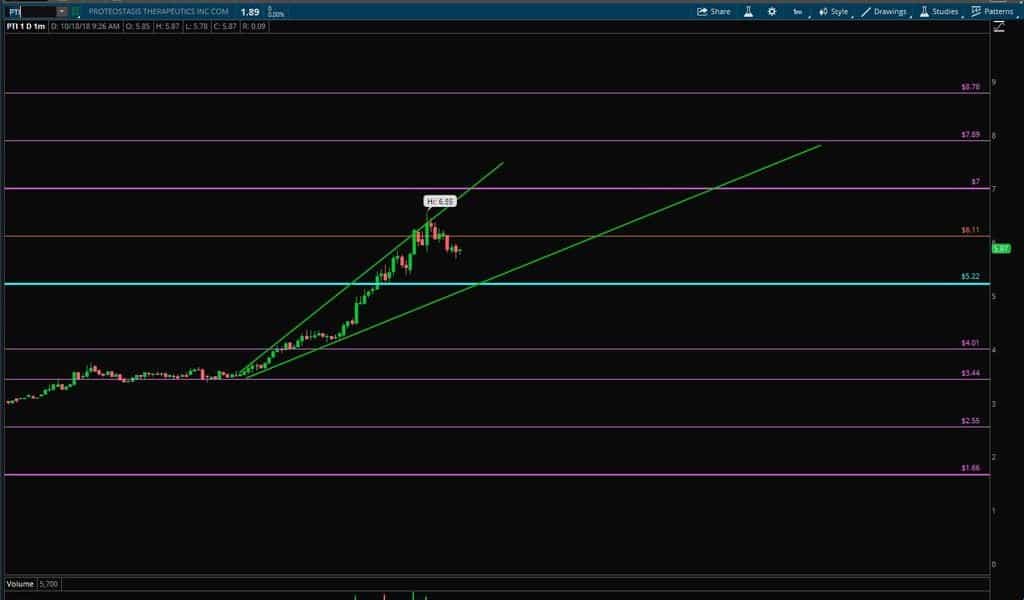
- Watch for a megaphone pattern to form downwards by connecting two to three sloping peaks and valleys (lower highs and lower lows).
- Watch for a megaphone pattern to form upwards by connecting two to three rising peaks and valleys (higher highs and higher lows).
- Connect the peaks and valleys via trend lines.
- Watch for buy areas when price hits lower trend lines.
- Watch for short areas when price rejects upper trend lines.
Can You Profit From a Broadening Formation?
Did you know that megaphone patterns are seen as a bearish pattern? You may be wondering why it’s bearish if it’s basically a reverse symmetrical triangle. Symmetrical triangles are neutral.
If you’re a long term trader or a trend trader, then the broadening formation is a bearish pattern for you. There’s so much volatility without a clear direction. This, however, is great news for day traders as well as swing traders.
Day trading and swing trading is all about capitalizing on volatility. Whereas long term investors or trend traders want to trade in a single direction. My day trading course is is full of helpful strategies to successfully trade many patterns such as the megaphone pattern.
Since this is a volatile pattern, you want to buy around the trend lines. Depending on your style, it’s best to go long when it’s hitting angular support. Go short when it’s hitting angular resistance. Be prepared to cover, because megaphones can break out to the upside, bursting free from the price structure (trend lines).
Technical Analysis of Megaphone Patterns
Trend lines are a large part of technical analysis. Hence the reason day and swing traders can profit off the volatility of a broadening formation. The goal is short term movements for profit.
Swing trading typically holds overnight up to 2 weeks. It’s all about your risk management. Technical indicators are there to help you get in and out of trades quickly. I typically will avoid megaphone patterns when swing trading, unless I am selling bull spreads BELOW the bottom trend line of the megaphone while the price action is in an UP SWING moving towards the top of the megaphone resistance.
You can use the trend lines as entry and exit points as well as stop losses. The widening of megaphone patterns means the potential to profit is higher. That can also mean the potential for loss is higher. Check the volume and keep an eye on the news. Is there something going on with this stock you should know about?
Hence the need to trade with proper risk management. Use the technical indicators to your advantage. Use the small 2-3 candlestick patterns also. These coupled together can provide good entries as well as exits.
Fear and Greed
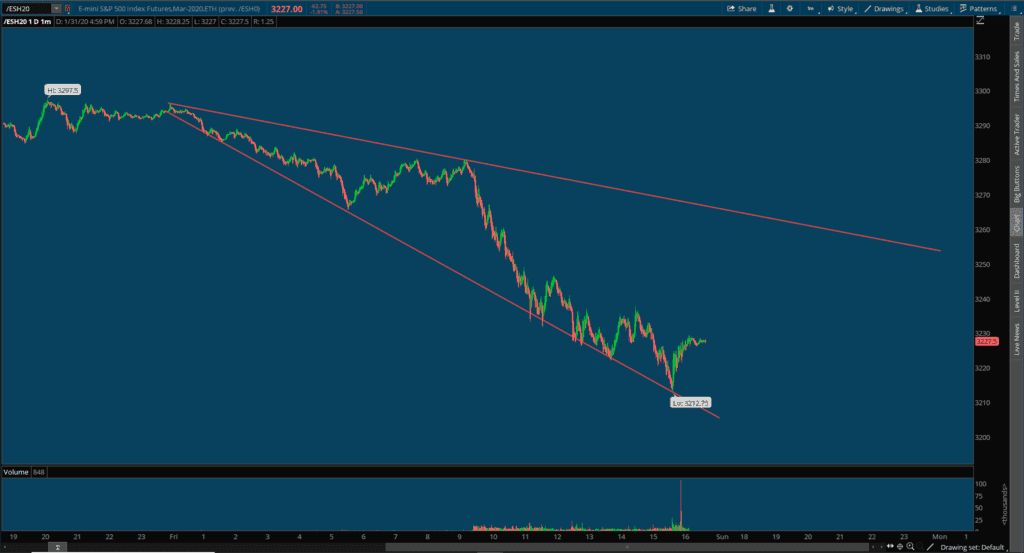
The megaphone can be found to the downside too. This pattern will develop during both fear and greed on the charts all the time. Check out the futures chart below. The Coronavirus scare spooked investors in the market and caused the price action to drop quite a bit. Always extend your trend lines out to the future peeps!
Summary
Megaphone patterns are most successful for day and swing traders. However, long term investors can use it as a signal to shore up their investments. Just like with any style of trading, it’s important to study and learn the differing patterns and what they mean.
Open a paper trading account and practice trading them. As a result, you’ll get good at drawing trend lines and connecting the dots to find the different patterns; which is a very important part of trading.
Remember, the megaphone chart pattern is just one of many patterns within patterns and you SHOULD learn as many patterns as you can to be a successful trader.
If Day Trading is something you would like to try, please practice in a simulator before putting real money on the line. Please learn a trusted profitable strategy. You can learn how to trade here: