How to trade bullish and bearish pennants
Bearish pennants and bullish pennants can indicate that major price action is on the cards – so understanding them is crucial for any technical trader. Here’s an introduction to how pennants work, and how to trade them.
What is a bullish pennant?
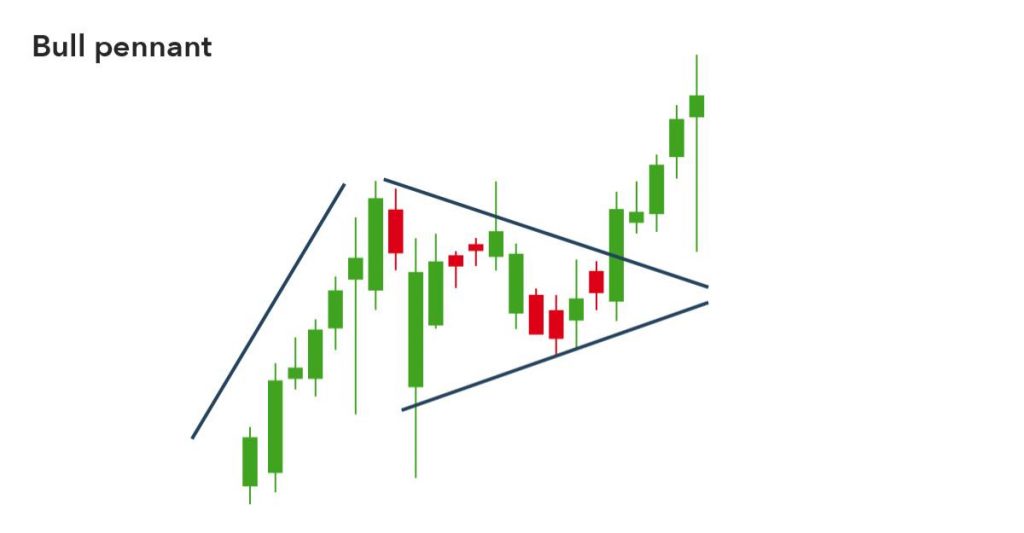
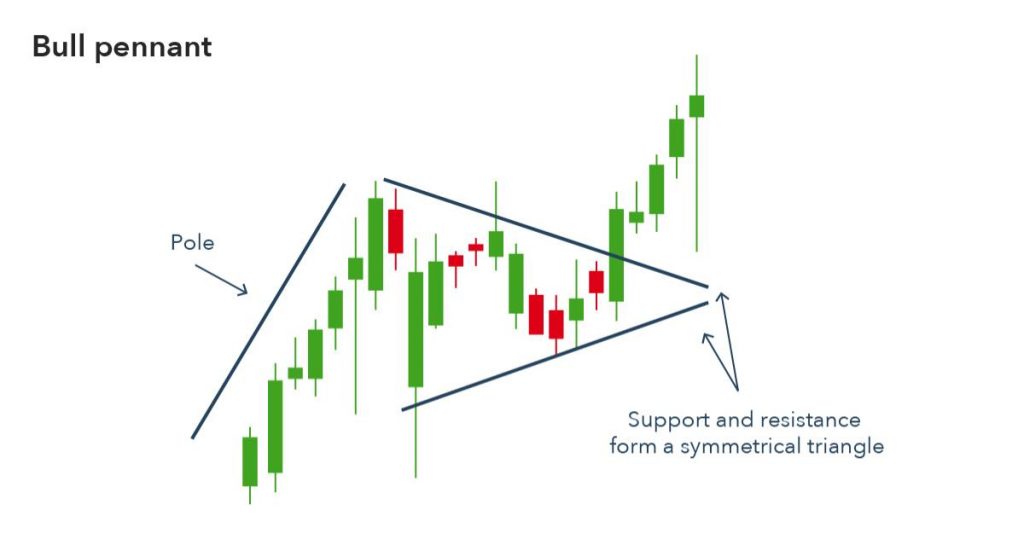
A bullish pennant is a technical trading pattern that indicates the impending continuation of a strong upward price move. They’re formed when a market makes an extensive move higher, then pauses and consolidates between converging support and resistance lines.
Technical traders take this as a sign that the original ascending price move is going to resume. This makes the bullish pennant pattern particularly sought after, as it can offer an early indication of significant upward price action.
The bullish pennant pattern can occur over lots of different time frames. Day traders look for them on second or minute charts, while longer-term traders spot ones that arise over weeks or even months.
Start trading pennants on the IBKR trading platform. Open a live account to get started.
How to identify bullish pennants
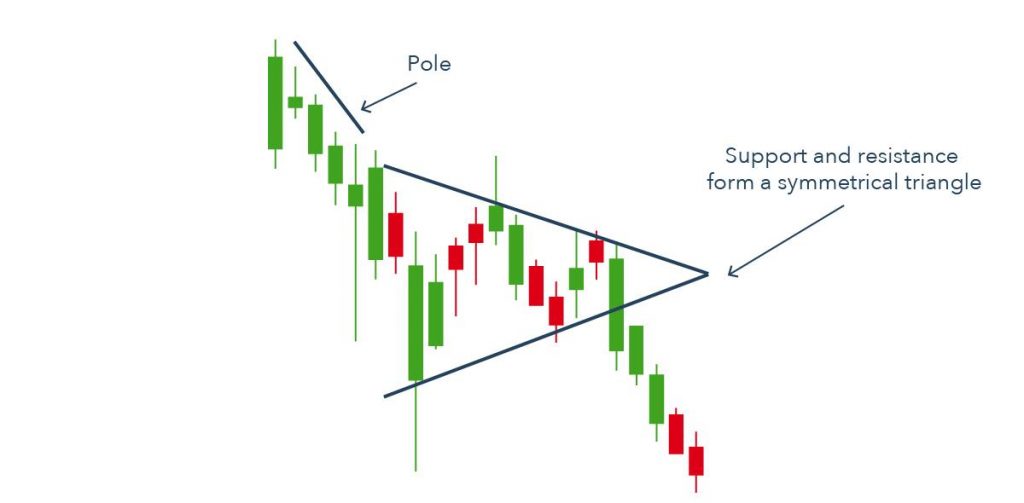
To identify a bullish pennant, you’ll need to watch for two elements. Firstly, a pronounced upward movement beforehand known as the ‘pole’. Secondly, a price consolidation that forms a roughly symmetrical triangle with its support and resistance lines.
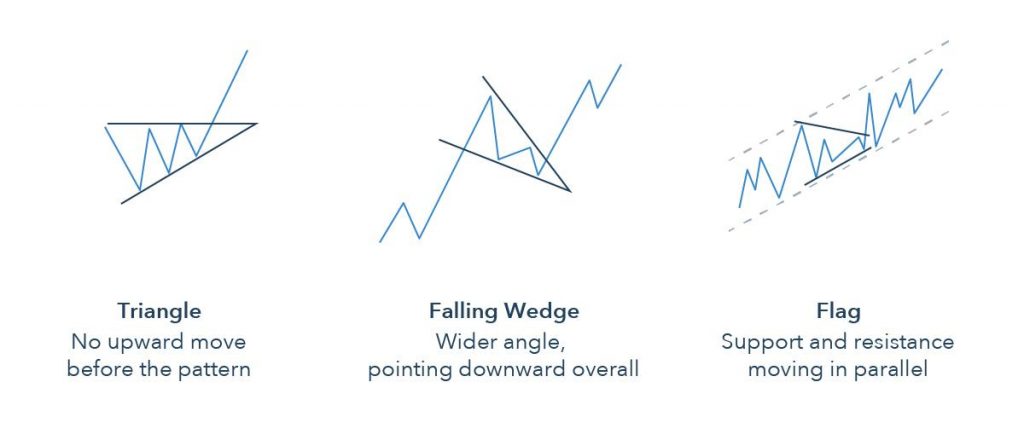
It’s important not to confuse bullish pennants with other patterns such as triangles, falling wedges and bullish flags.
- Unlike triangles, there’s a significant upward move before the pattern
- Unlike falling wedges, the consolidation is roughly equal – with a falling wedge, the support and resistance lines both point down. Pennants are usually also tighter than wedges
- Unlike bullish flags, the support and resistance lines form a triangle instead of moving in parallel
One extra clue that a bullish pennant is forming is falling volume as price consolidates. Then, when the market begins to break out of the pattern, volume spikes.
What’s happening in a bullish pennant?
In a bullish pennant, strong positive sentiment causes a market to spike higher (forming the pole). The buyers that have pushed the market higher then might back off and take profit, while bears sense the potential for a retracement. This parity between supply and demand causes its price to consolidate.
This parity can’t last forever, though. In a bullish pennant, the positive sentiment wins out. Those traders who have been waiting to buy the market leap in and send it skyward once more.
What is a bearish pennant?
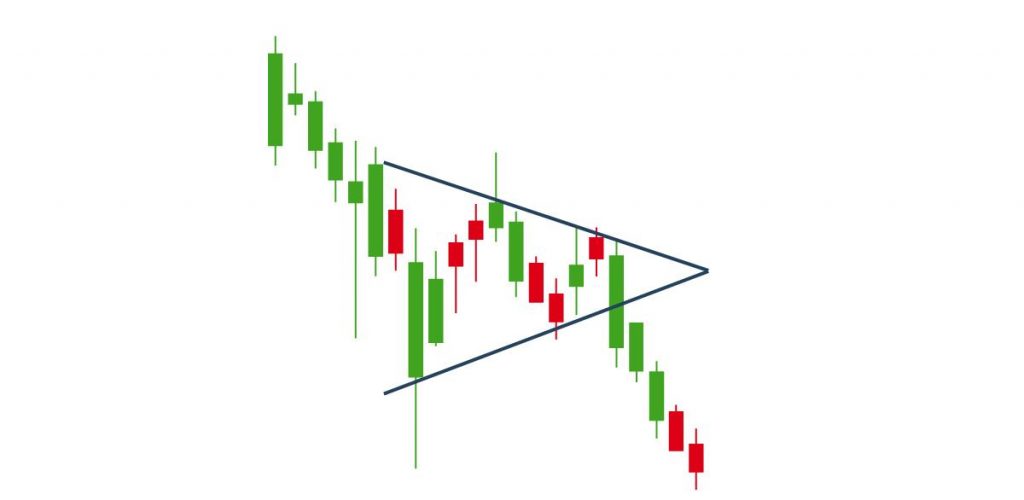
A bearish pennant is a technical trading pattern that indicates the impending continuation of a downward price move. They’re essentially the opposite to bullish pennants: instead of consolidating after a move up, the market pauses on a significant move down.
When technical traders spot a bearish flag pennant, they take it as a sign that the downward price move is going to continue once the market breaks below its support line. Like their counterpart, bearish pennants can occur over any time frame.
How to identify a bearish pennant
To identify a bearish pennant, look for a consolidation between support and resistance after a major bearish price move (the pole). The support and resistance lines will form a roughly symmetrical triangle, showing that the market is in conflict between positive and negative sentiment.
Like with bullish pennants, falling volume is often a good sign that a bearish pennant is forming. The volume then rapidly builds once the market breaks out.
What’s happening in a bearish pennant?
In a bearish pennant, strong negative sentiment causes a market to plummet lower (forming the pole). The sellers that have pushed its price down might then back off and take profit, while bulls sense the potential for a bounce back.
Like with bullish pennants, this causes the market’s price to consolidate. But consolidation can’t last forever, and without enough bullish sentiment to recover, the market turns bearish once more. Once it moves outside of its support line, any sellers who have been holding back jump on – sending it to new lows.
Spotting bearish and bullish pennants can be tricky at first because the consolidation is often small when compared to the preceding price move. To practise identifying and trading patterns without risking any capital, open an IBKR demo account today.
Bullish vs bearish pennants: what’s the difference?
| Bullish pennants | Bearish pennants |
| Arise when a market consolidates after a pronounced upward move | Arise when a market consolidates after a pronounced downward move |
| Indicate the continuation of a bull market | Indicate the continuation of a bear market |
| Break out when the market moves beyond its resistance line | Break out when the market moves beyond its support line |
To buy or sell pennants, you’ll need to plan when to open your position, take a profit and cut a loss.
When to open a pennant position
Pennants are sought after by traders because they tend to lead to extended breakouts. So when you’re trading them, you want to find the perfect place to open your position and ride the subsequent move.
There are two main methods to choose from here. The first is simply to wait until the market breaks above its trend line: its line of resistance for bullish pennants, and support for bearish ones.
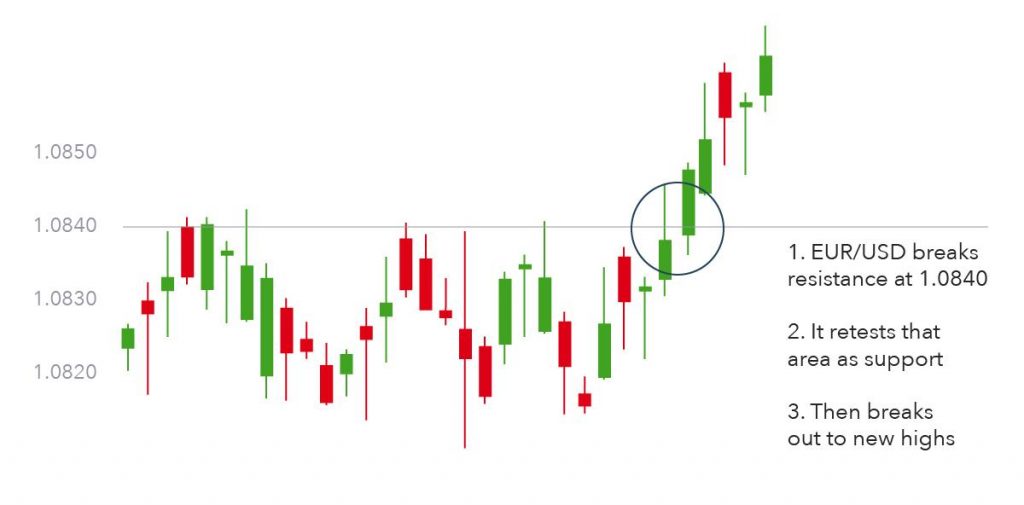
The second is to use the general rule of thumb that markets will often revert briefly before a full breakout begins. In these cases, the previous support turns into resistance – and resistance into support. Say, for example, that EUR/USD enters into a bullish wedge and breaks its resistance line at $1.084. That price may become a support line as the market retests its previous range before market surging higher. By placing a buy order at $1.084, you can make the most from the following bull move.
Where to take profit
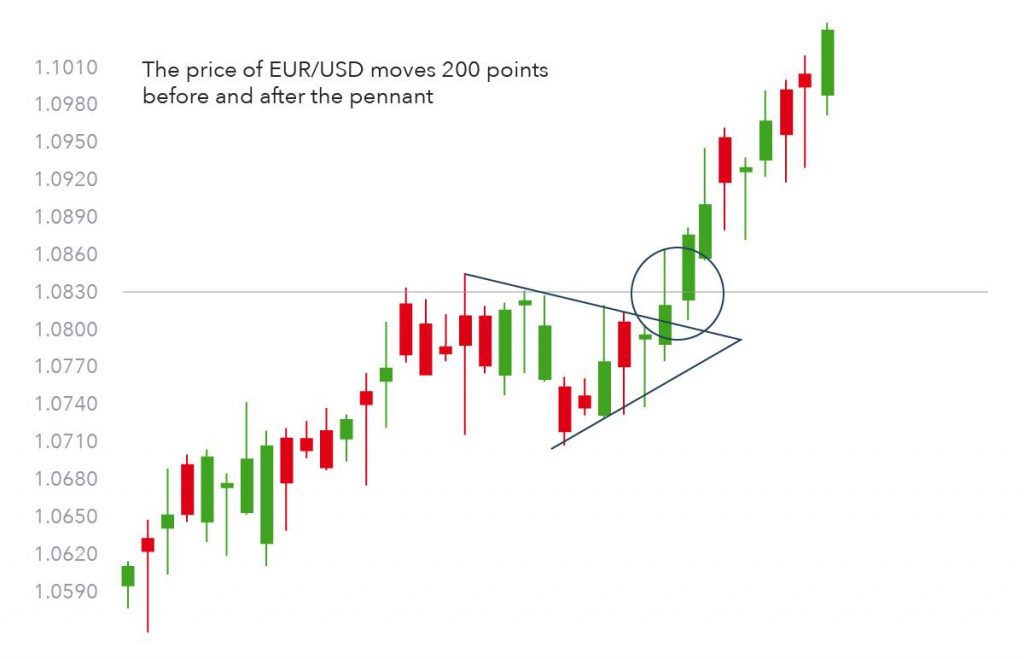
Unlike trading other chart patterns, the original range of a pennant is rarely used to plan where to take profit. Instead, the breakout often matches the size of the bear or bull move that preceded the consolidation.
Continuing our EUR/USD example from earlier, say that the market had risen 200 points before pausing. Once it breaks out beyond resistance, technical traders would expect it to make another 200-point move.
Where to cut losses
Where you place your stop will depend on your chosen entry strategy.
If you’ve opened your position as soon as the market breaks beyond support or resistance, then you’ll want to cut losses once it’s clear that the pattern has broken. This is usually done by placing your stop at the opposite trendline:
- On a bullish pennant, you’d place your stop just beneath the support trendline
- On a bearish pennant, you’d place your stop just above the resistance trendline
If you’ve waited until the market retests its old area of support or resistance, you’d place your stop a few points below your entry position. You’ll want to give enough room for the price to oscillate before any breakout takes hold, but not so much that your losses are too great if the pattern breaks.
With both strategies, your stop is far closer than the point at which you take profit. This is one reason why pennants are so sought after by traders – relative to other patterns, the risk-reward ratio tends to be high. For our EUR/USD trade, for example, you might be risking 10 or 20 points in exchange for 200 points of potential profit.
Bullish and bearish pennants summed up
- Pennants are a technical pattern used to identify continuations of sharp price moves
- Bearish pennants occur when a bear move pauses, while bullish pennants occur when bull moves pause
- Trading them requires planning when to open your position, take a profit and cut a loss
Learn more about pattern trading with Tony
If Day Trading is something you would like to try, please practice in a simulator before putting real money on the line. Please learn a trusted profitable strategy. You can learn how to trade here: